
A Computer Learning How To Snowboard
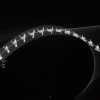
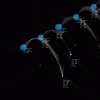
Animated data visualisation by Andreas Koller showing the process of a computer exploring and understanding athletic movements, simply and beautifully presented in interactive WebGL – video example embedded below:
This screencast shows the process with random values for velocity, take off strength, and X, Y, Z rotations. After eight attempts the best result is kept and repeatedly shown …
This project also explores the human body as a visual instrument. How does the body, with its many inputs and outputs, perform as a tool for visual expression? What data does an athletic movement produce and how could it be made visible? How do we understand and remember complex movement patterns?
You can try it out for yourself here, and find out more about the project here
Andreas Koller also has a Tumblr blog (akllr) here