Results from Data Scraping
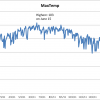
So I’m pretty happy with today’s work: In a little less than 3 hours (including blogging about all this and looking up lots of related stuff), I was able to use Python to scrape 365 Web pages and export a comma-delimited file of the maximum recorded temperature for every day in 2011 for Gainesville, Florida.
I opened the file with Excel and used the built-in chart tools to create the graphic above, which is quite simple — but it’s showing all the data from that scrape! So cool!
You can view a Google Spreadsheets version > here.